Modelling the CrossFit Open: Which Fitness Attributes Predict Performance?
Why Model the Open?
CrossFit programming is difficult. Athletes need to build proficiency across dozens of movements, in time domains ranging from two minutes to twenty, in combinations that change every workout. What builds capacity for one athlete may not work for another because individual responses vary. Coaches make thoughtful decisions, but those decisions benefit from being grounded in data.
Statistical modelling offers a lens for understanding individual needs against normative standards. By fitting predictive models to large samples of athletes, we can determine which fitness attributes actually separate performers in competition. There are thresholds below which athletes struggle, capacities that show diminishing returns and those that keep paying dividends.
I’ve built statistical models for each of the three 2025 Open workouts, using twelve fitness metrics measured before the Open to predict performance. The goal was to quantify which attributes drive performance and by how much, so athletes can benchmark themselves against normative targets.
Two findings emerged:
Skills transfer to better athleticism. Athletes who can do ring muscle-ups, strict handstand push-ups, and handstand walks perform better across all workouts. Some skills proxy for tested movements, while others transfer even when nothing similar is tested.
5K run time is the dominant differentiator. Across all three workouts, aerobic capacity measured by 5K time predicted performance more strongly than any other factor.
Different capacities show different return profiles. Skills are high leverage bets for performance. Strength shows threshold effects, in that returns diminish once an athlete has enough. Aerobic capacity and pulling endurance show no plateau. This hierarchy can inform how athletes allocate training time.
The Data
I’ve analysed athletes with complete data across all twelve predictors. Seven continuous metrics were pulled from the athlete’s open profile, and five binary skills were derived from previous Open and Quarterfinal workouts.
The selection is therefore not random. Median lifts were around 120 kg clean & jerk and 170 kg back squat for men. This matters for interpretation, since findings apply to athletes with a notable training background. We need to be careful about extrapolating significantly to athletes building baseline strength.
The Predictors
Seven continuous metrics:
| Metric | Source | Notes |
|---|---|---|
| Back squat | Profile | 1RM in kg |
| Deadlift | Profile | 1RM in kg |
| Clean & jerk skill | Residualised | Technique component (see below) |
| Snatch skill | Residualised | Technique component (see below) |
| Max pull-ups | Profile | Unbroken reps |
| 5K run | Profile | Time (faster = better) |
| 400m sprint | Profile | Time (faster = better) |
Five binary skills:
| Skill | Workout(s) | Threshold | Definition |
|---|---|---|---|
| Ring muscle-ups | Open 23.1, QF 24.3 | ≥180 reps, ≥21 reps | Reached the RMU section |
| Bar muscle-ups | Open 21.3, 22.3, 24.3, QF 23.5 | ≥135, ≥156, ≥156, ≥16 reps | Reached the BMU section |
| Strict HSPU | Open 23.3 | ≥137 reps | Reached the strict HSPU section |
| Pistols | Open 20.4, QF 21.2 | ≥131, ≥67 reps | Reached the pistol section |
| Handstand walks | Open 20.3, QF 23.1 | ≥112, ≥10 reps | Reached the HSW section |
The skill variables are valuable, because they are performance-derived, unlike the self-reported continuous metrics. Athletes who had the opportunity to complete the skill in the workout, but didn’t, are marked as not having the skill (positive evidence of absence), whereas those who did not have the opportunity are marked as unknown. For example, in 23.1 an athlete who completed the 30 cleans (the movement immediately before ring muscle-ups in that workout), but not a ring muscle up would be marked as not having the skill. Any athlete who did not complete the 30 cleans would be marked as unknown for the skill.
Isolating Olympic Lift Technique
Raw Olympic lift numbers conflate two things: how strong you are, and how efficiently you convert that strength into a lift. A 100 kg snatch means something different for an athlete with a 170 kg squat versus a 200 kg squat.
To isolate technique, I residualised each Olympic lift against back squat and deadlift. For male athletes:
Expected CJ (kg) = 2.7 + 0.37 × squat + 0.25 × deadlift
Expected Snatch (kg) = -0.2 + 0.34 × squat + 0.16 × deadlift
An athlete with a 150 kg squat and 190 kg deadlift would be expected to clean & jerk around 106 kg and snatch around 81 kg. Athletes lifting more than predicted have positive skill residuals (better technique/explosiveness); those lifting less have negative residuals (leaving kilos on the platform).
The Model
I fit separate Bayesian statistical models for each workout and gender (six models total). The structure differs by workout type:
25.1: The number of reps is modelled using a Negative binomial likelihood, which naturally handles the integer outcome. As this workout is a pure AMRAP, where each rep is roughly equal between movements, we don’t need to account for distinctions in rep counts.
25.2 and 25.3: Both workouts are for time, but for a majority of athletes (who don’t expect to finish) rep count is what matters. Beta-binomial likelihood naturally counts reps as a “trial” out of the maximum possible. This respects the natural upper bound, since athletes can’t score more than the max reps, and lets the completion probability (scoring all reps) fall out directly from the distribution. Athletes who finished follow a lognormal distribution for completion time.
This structure allows us to investigate effects between what predicts finishing a workout, and amongst finishers what predicts speed.
Why Hill Dose-Response Curves
All continuous predictors were transformed through Hill dose-response curves rather than entering linearly. The Hill function has two parameters: EC50 (the predictor value where the effect reaches half its maximum) and slope (how sharply the effect transitions).
This choice is domain-driven:
Threshold effects are expected. An athlete with a 100 kg squat will struggle on workouts requiring heavy cleans. There’s a minimum strength floor below which performance drops off sharply. Hill curves capture this with the steep portion around EC50.
Diminishing returns are expected. Going from a 200 kg to 250 kg squat doesn’t help Open performance as much as going from 100 kg to 150 kg. Hill curves saturate naturally, so the effect plateaus as you move well above EC50.
EC50 is directly interpretable. It tells you at what fitness level the biggest marginal gains occur. This is more useful for training recommendations than a coefficient from a linear model.
Complexity adapts to effect size. The model uses adaptive priors that pull weak predictors toward simple (nearly linear) curves while allowing strong predictors to express sharp thresholds. A predictor with a small effect doesn’t get to fit a complex curve to noise.
Effect sizes (θ) represent the maximum change in log-outcome across the predictor range. For binary skills, θ is the difference between having and not having the skill. Larger absolute θ means stronger predictive effect.
Results
The combination of EC50 and θ tells you both where the effect happens and how big it is. Three predictors from the 25.1 male model illustrate the range of patterns:
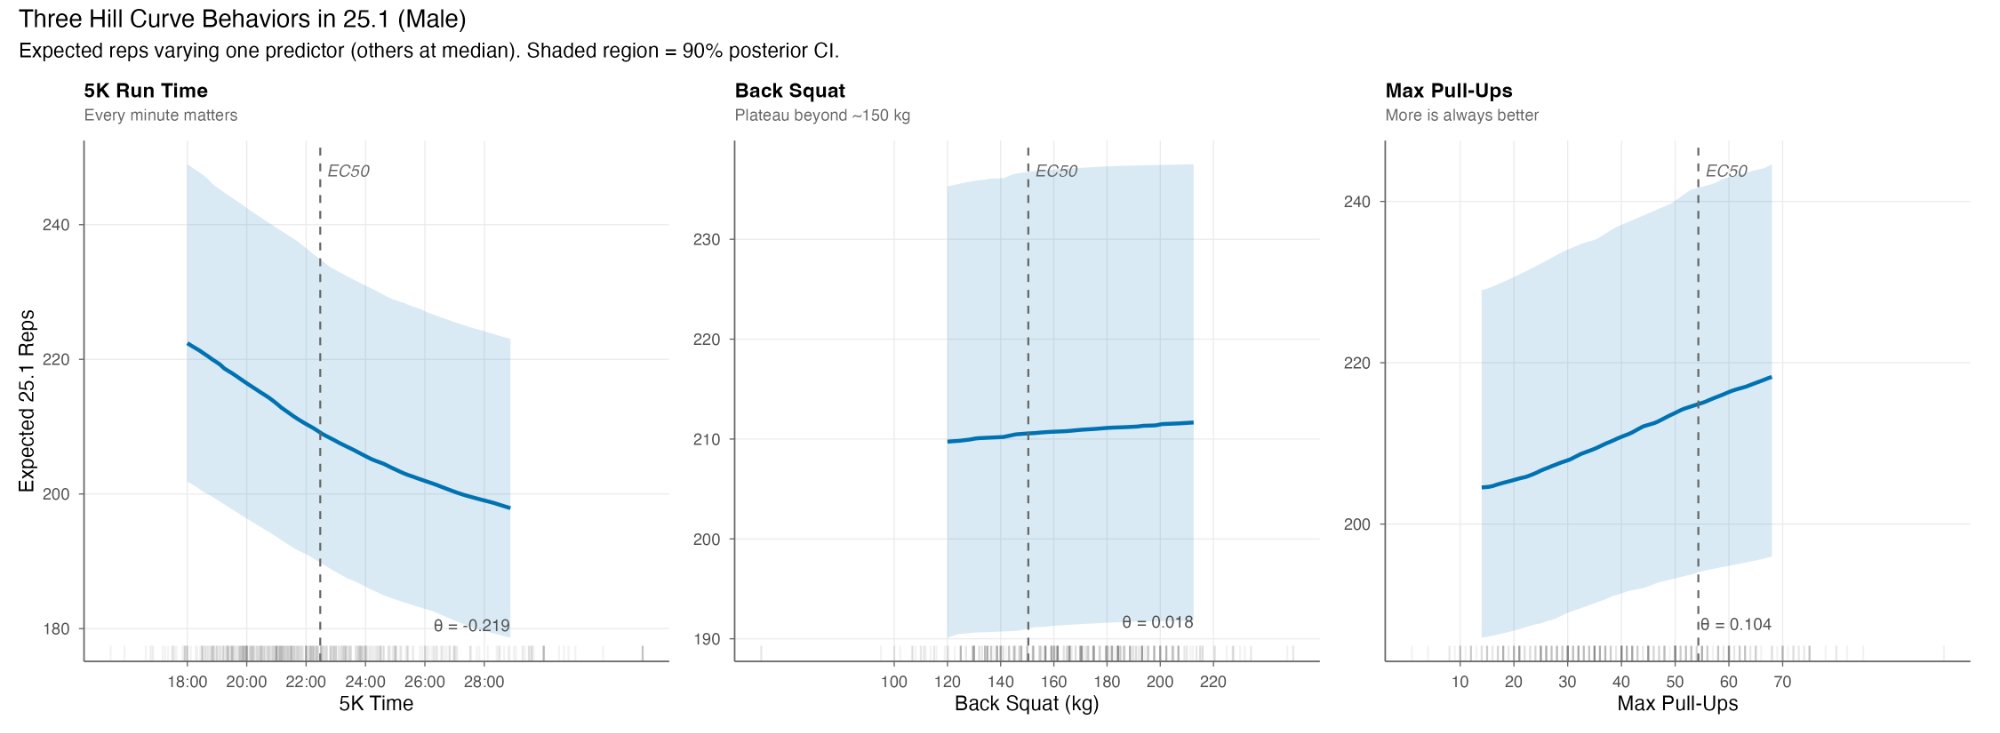
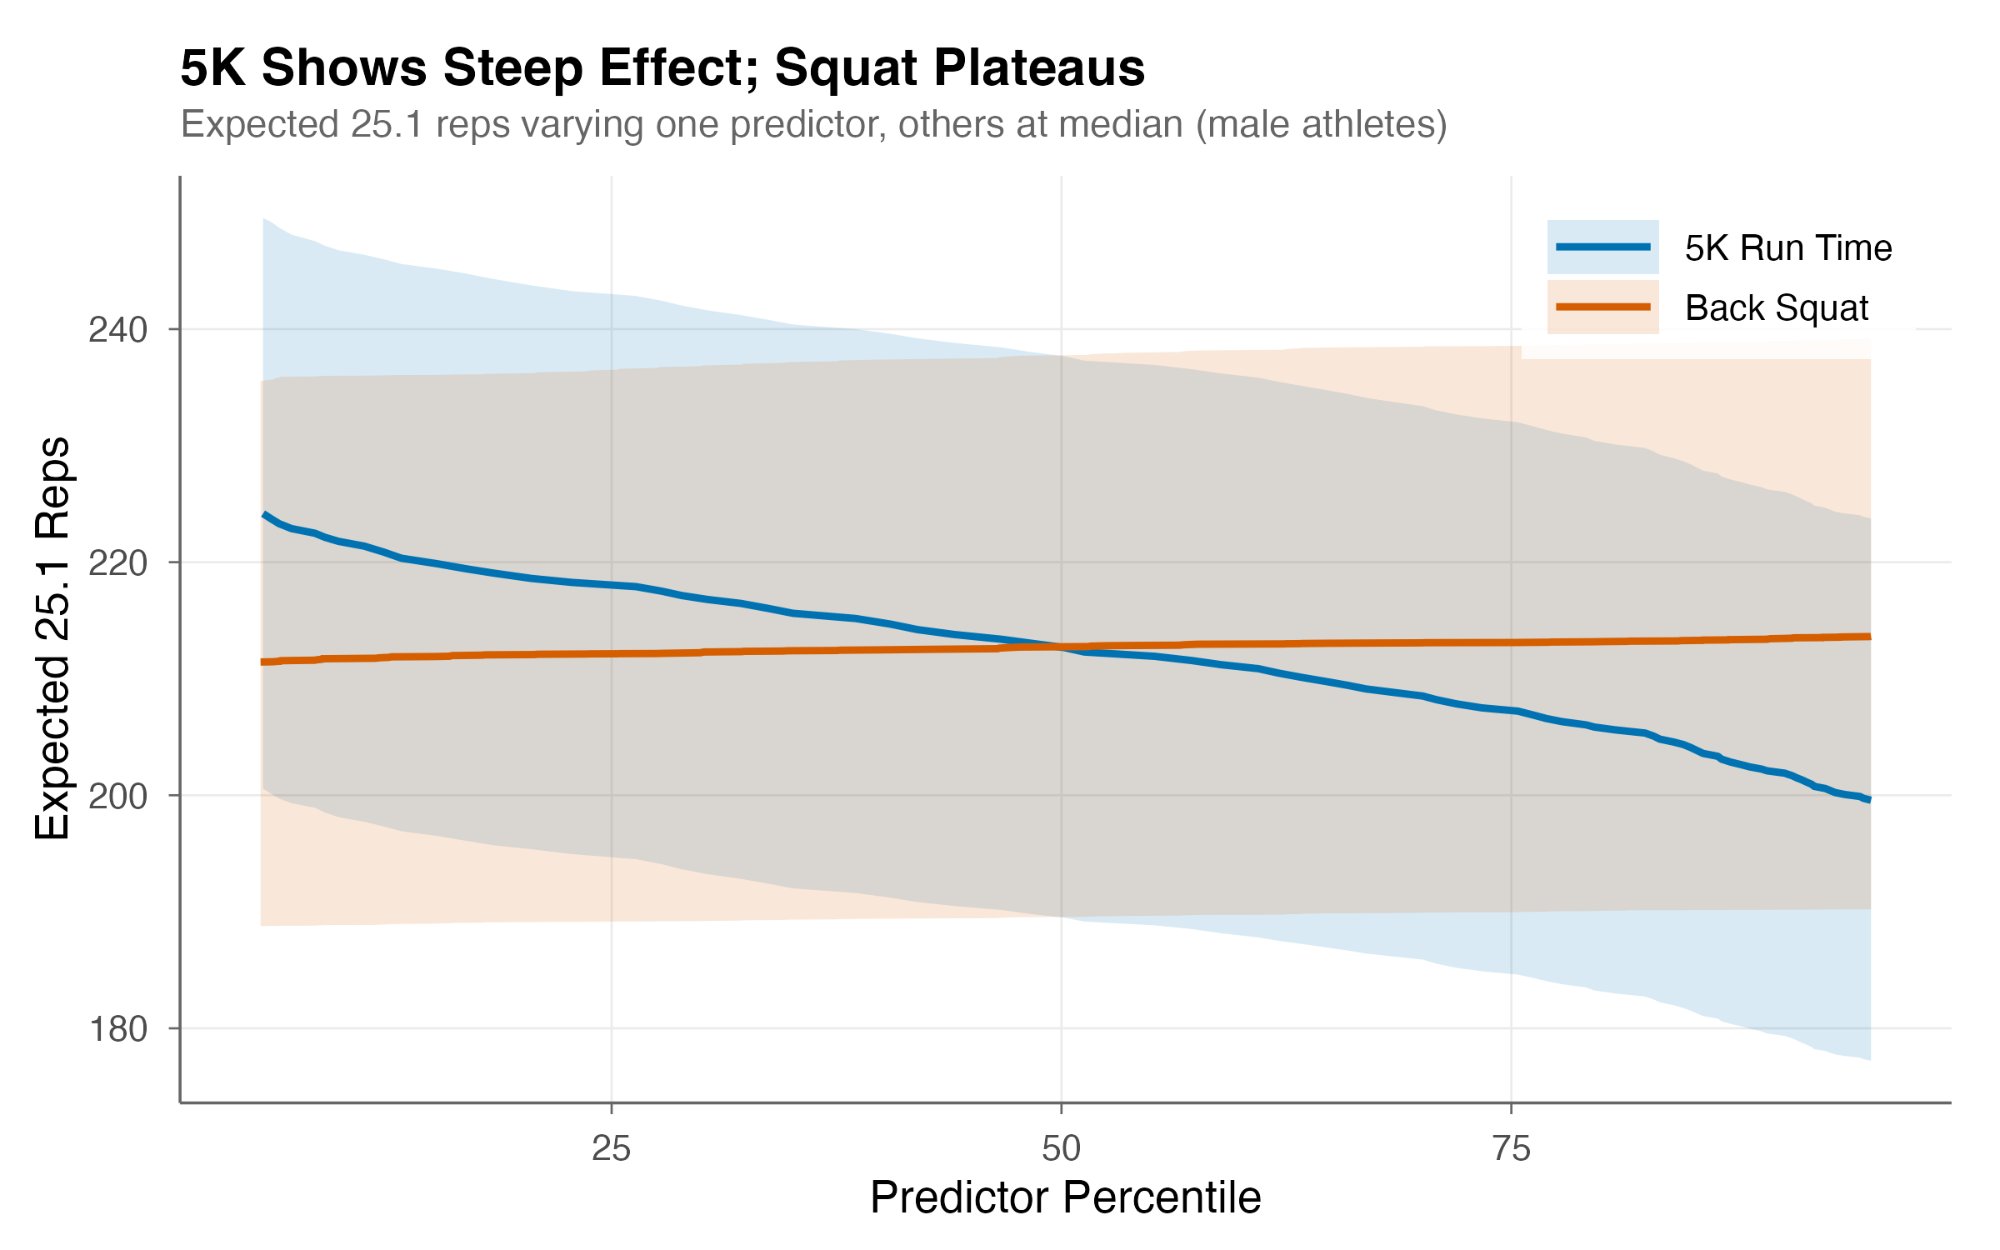
5K run time has an EC50 of 22:37—almost exactly the sample median (21:50). This means the effect is active across the entire observed range, with no plateau. Combined with the largest θ of any continuous predictor (-0.219), this explains why 5K dominates: every minute matters, for everyone.
Back squat has an EC50 of 149 kg (329 lb)—near the 25th percentile, meaning 75% of athletes are already past the inflection point. But θ is only 0.018, essentially zero. The effect barely exists regardless of where you are on the curve. Beyond ~150 kg, additional squat strength provides no detectable benefit for 25.1 performance.
Max pull-ups has an EC50 of 54 reps—between the 75th and 90th percentiles. Most athletes are still on the rising portion of the curve. With a moderate θ (0.104), pulling capacity continues to differentiate athletes throughout the observed range. No plateau in sight.
| Predictor | EC50 | Where in the data | θ | Interpretation |
|---|---|---|---|---|
| 5K run | 22:37 | At median | -0.219 | Active everywhere—every minute matters |
| Back squat | 149 kg / 329 lb | At 25th percentile | 0.018 | Plateau—beyond ~150 kg, no benefit |
| Max pull-ups | 54 reps | Above 75th percentile | 0.104 | Still rising—more is always better |
Combining EC50 position with effect magnitude applies to any domain where you expect thresholds and diminishing returns. 400m sprint time showed smaller effects than 5K across all workouts, suggesting sustained output matters more than short-burst capacity for Open time domains.
Notably, Olympic lift technique (the residualised snatch and clean & jerk skill variables) showed a specific pattern. Neither predicted completion probability, as other factors determined whether athletes had the ability to finish. But snatch skill mattered for finishers competing on time. Athletes at the 90th percentile of snatch efficiency finished 52 seconds faster in 25.2 and 32 seconds faster in 25.3 compared to those at the 10th percentile. Clean & jerk skill showed smaller, marginal effects.
Two main findings emerge from the full analysis:
Finding 1: Skills Transfer to Better Athleticism
The clearest pattern in the data was that binary skill indicators predicted performance across workouts. This includes workouts that didn’t directly test those skills.
Skills matter in different ways. Some proxy for tested movements (such as strict HSPU ability predicting wall walk performance), and some transfer even when nothing similar is tested (ring muscle-up ability predicting a workout with no gymnastics pulling).
Proxy Skills: Strict HSPU and Wall Walks
Strict HSPU ability showed the largest effect of any predictor in 25.3 (a workout with 25 wall walks, not handstand push-ups). Male athletes with strict HSPU were 14 percentage points more likely to finish.
This is largely proxy, as we don’t have a good measure of wall walk ability. Wall walks require pressing strength and wrist stability, as do strict HSPU. Athletes good at strict HSPU tend to be good at wall walks. The underlying capacities overlap (shoulder stability, pressing strength, wrist integrity, comfort inverted) even though the movement patterns differ (bent-arm press vs straight-arm press).
The effect suggests strict HSPU work likely carries over to wall walks, though we can’t isolate the mechanism without a direct wall walk measure.
Transfer Skills: When Nothing Similar Is Tested
Some skills predicted performance even when the workout contained nothing similar.
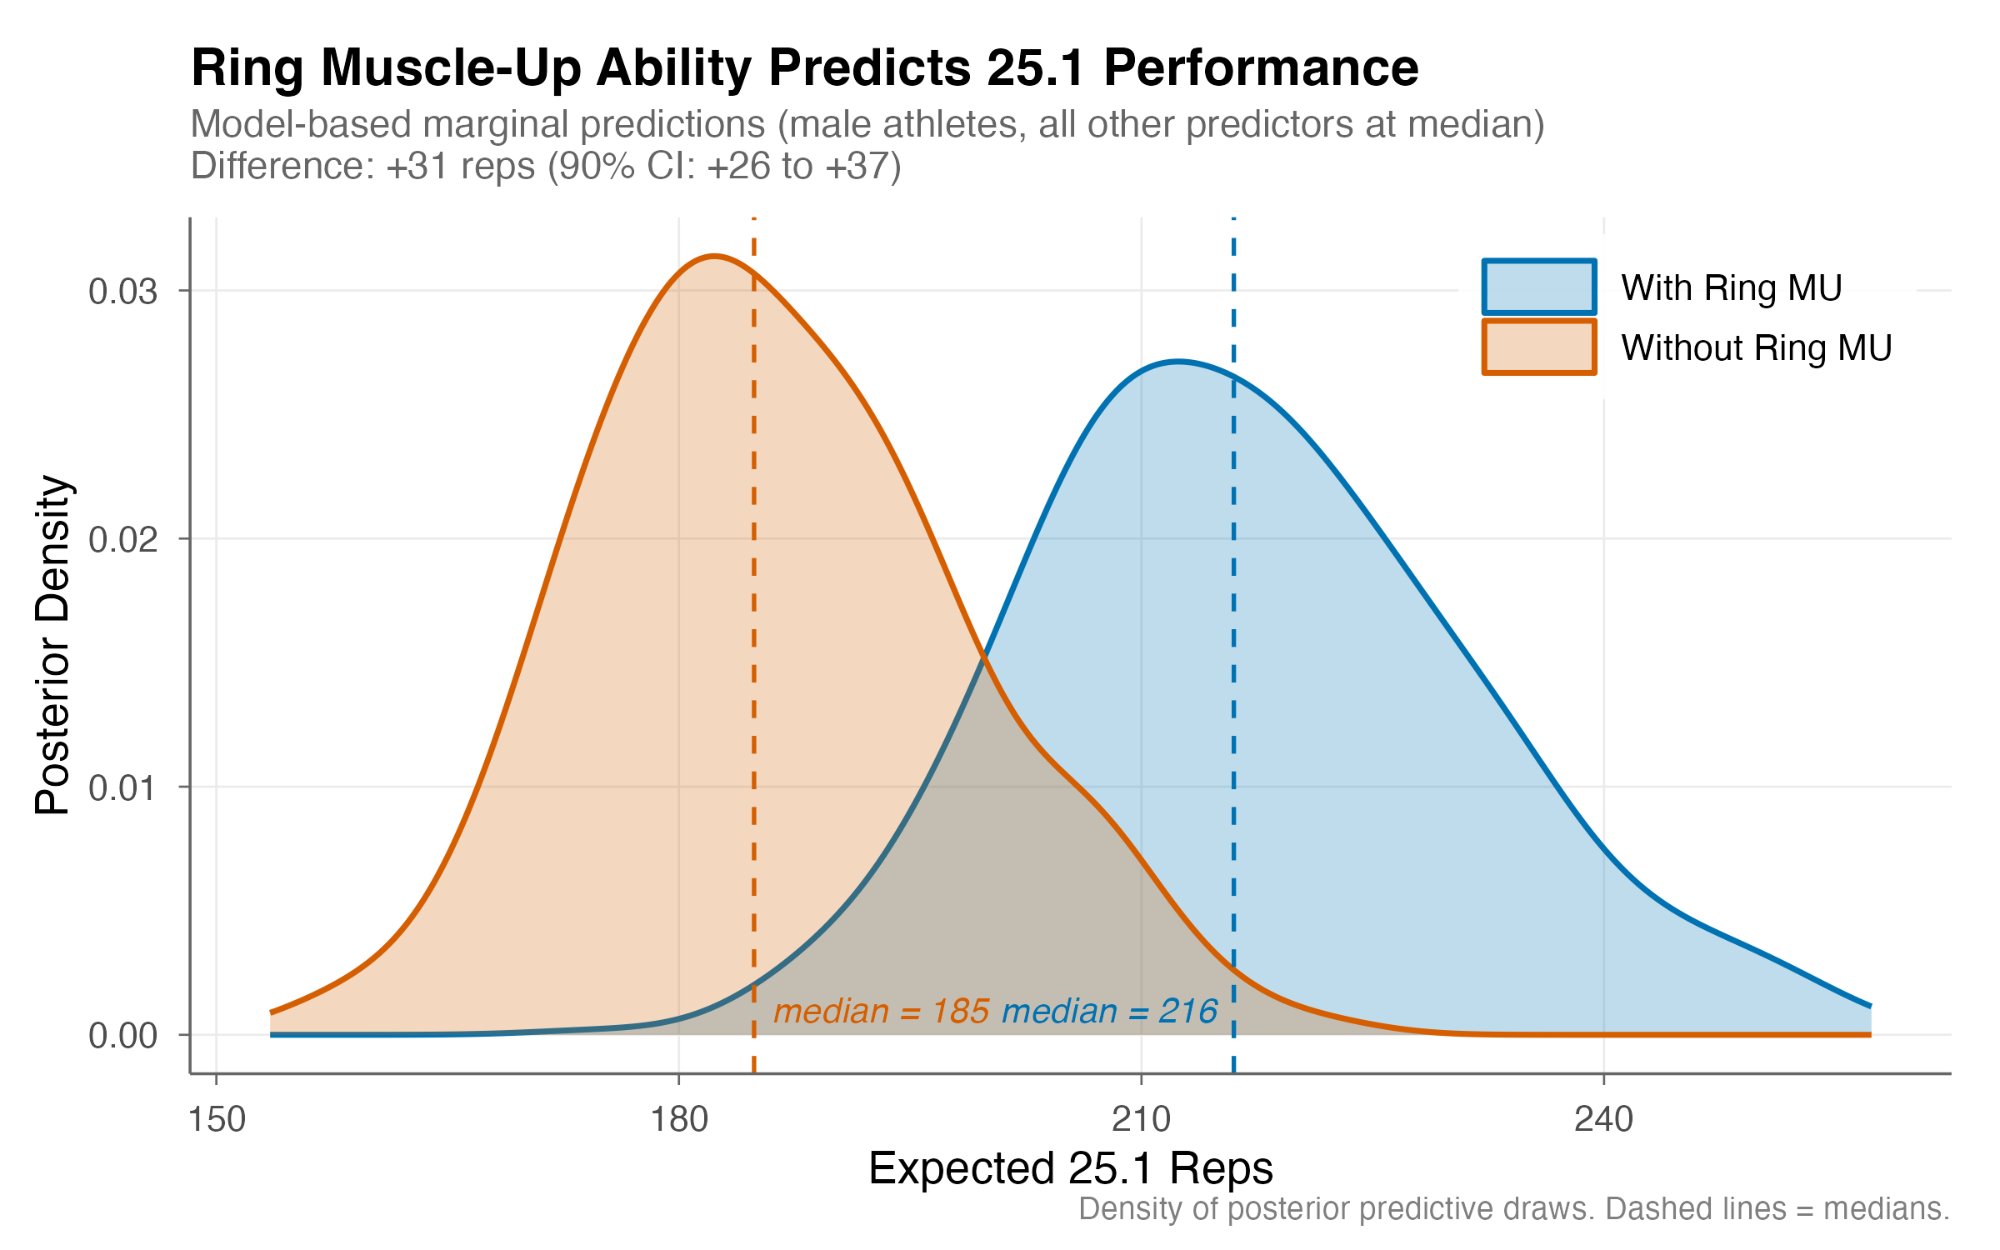
Ring muscle-up ability predicted 25.1—a workout with no gymnastics pulling at all. Just burpees, dumbbell hang clean-to-overheads, and walking lunges. Holding all other predictors at their median, male athletes with ring muscle-ups are predicted to score 216 reps; those without, 185 reps. That’s a 31-rep marginal effect (90% CI: 26 to 37 reps).
Strict HSPU ability also predicted 25.2, which had no handstand push-ups or wall walks. Male athletes with strict HSPU were 9 percentage points more likely to finish.
Whether this represents genuine transfer is hard to disentangle. Skills building capacities that help elsewhere, or selection effects where more skills represent better athletes. Likely both are at play. It’s clear that skill indicators predict performance past the movements they directly measure.
The pattern extends beyond ring muscle-ups. Handstand walk ability predicted performance across all three workouts—even 25.1 and 25.2, which had no handstand work. Bar muscle-up ability showed similar consistency, predicting 25.1 and 25.3 performance despite neither workout including bar muscle-ups. These aren’t large effects individually, but they’re persistent.
Max Pull-Ups: Always Relevant
Max pull-ups (a continuous metric, not binary) predicted all three workouts with no apparent ceiling.
In 25.1, athletes at the 10th percentile for pull-ups (20 reps) averaged 206 total reps. Athletes at the 90th percentile (60 reps) averaged 217 reps—an 11-rep difference. In 25.2, athletes at the top of the pull-up range were about 3 percentage points more likely to finish than those at the bottom.
The effect didn’t flatten. Unlike binary skills where crossing the gate is what matters, pulling endurance kept paying dividends across the entire range. This held even after accounting for muscle-up ability. It appears that pulling endurance is a distinct capacity from the binary skill of muscle-ups.
The ability to move efficiently through pulling movements, by maintaining position and minimising energy leakage, keeps paying dividends in a way that additional squat strength (for example) does not.
Pistols and Single-Leg Strength
Pistol ability showed larger effects for women, particularly in 25.3. Female athletes with the skill finished about 50 seconds faster than those without (θ = -0.043). The effect for men was roughly half that size.
None of the 2025 workouts included pistols. But pistol capability indicates single-leg strength, balance, and hip mobility. These are capacities that transfer to lunges (25.1), heavy deadlifts (25.3), and general stability under load. Perhaps when barbell loads are higher relative to bodyweight, as they are for women on 25.3’s 155 lb deadlift and 85 lb clean, single-leg strength becomes more differentiating.
The Training Implication
Skill acquisition isn’t just about passing tests that include those skills. It’s also about building underlying capacities that transfer broadly, whether as proxies for tested movements or as genuine transfer to unrelated work.
For athletes missing key skills, like ring muscle-ups, strict HSPU, handstand walks, pistols, acquisition work is high leverage, building capacities that help everywhere.
Finding 2: 5K Run Time Is the Dominant Differentiator
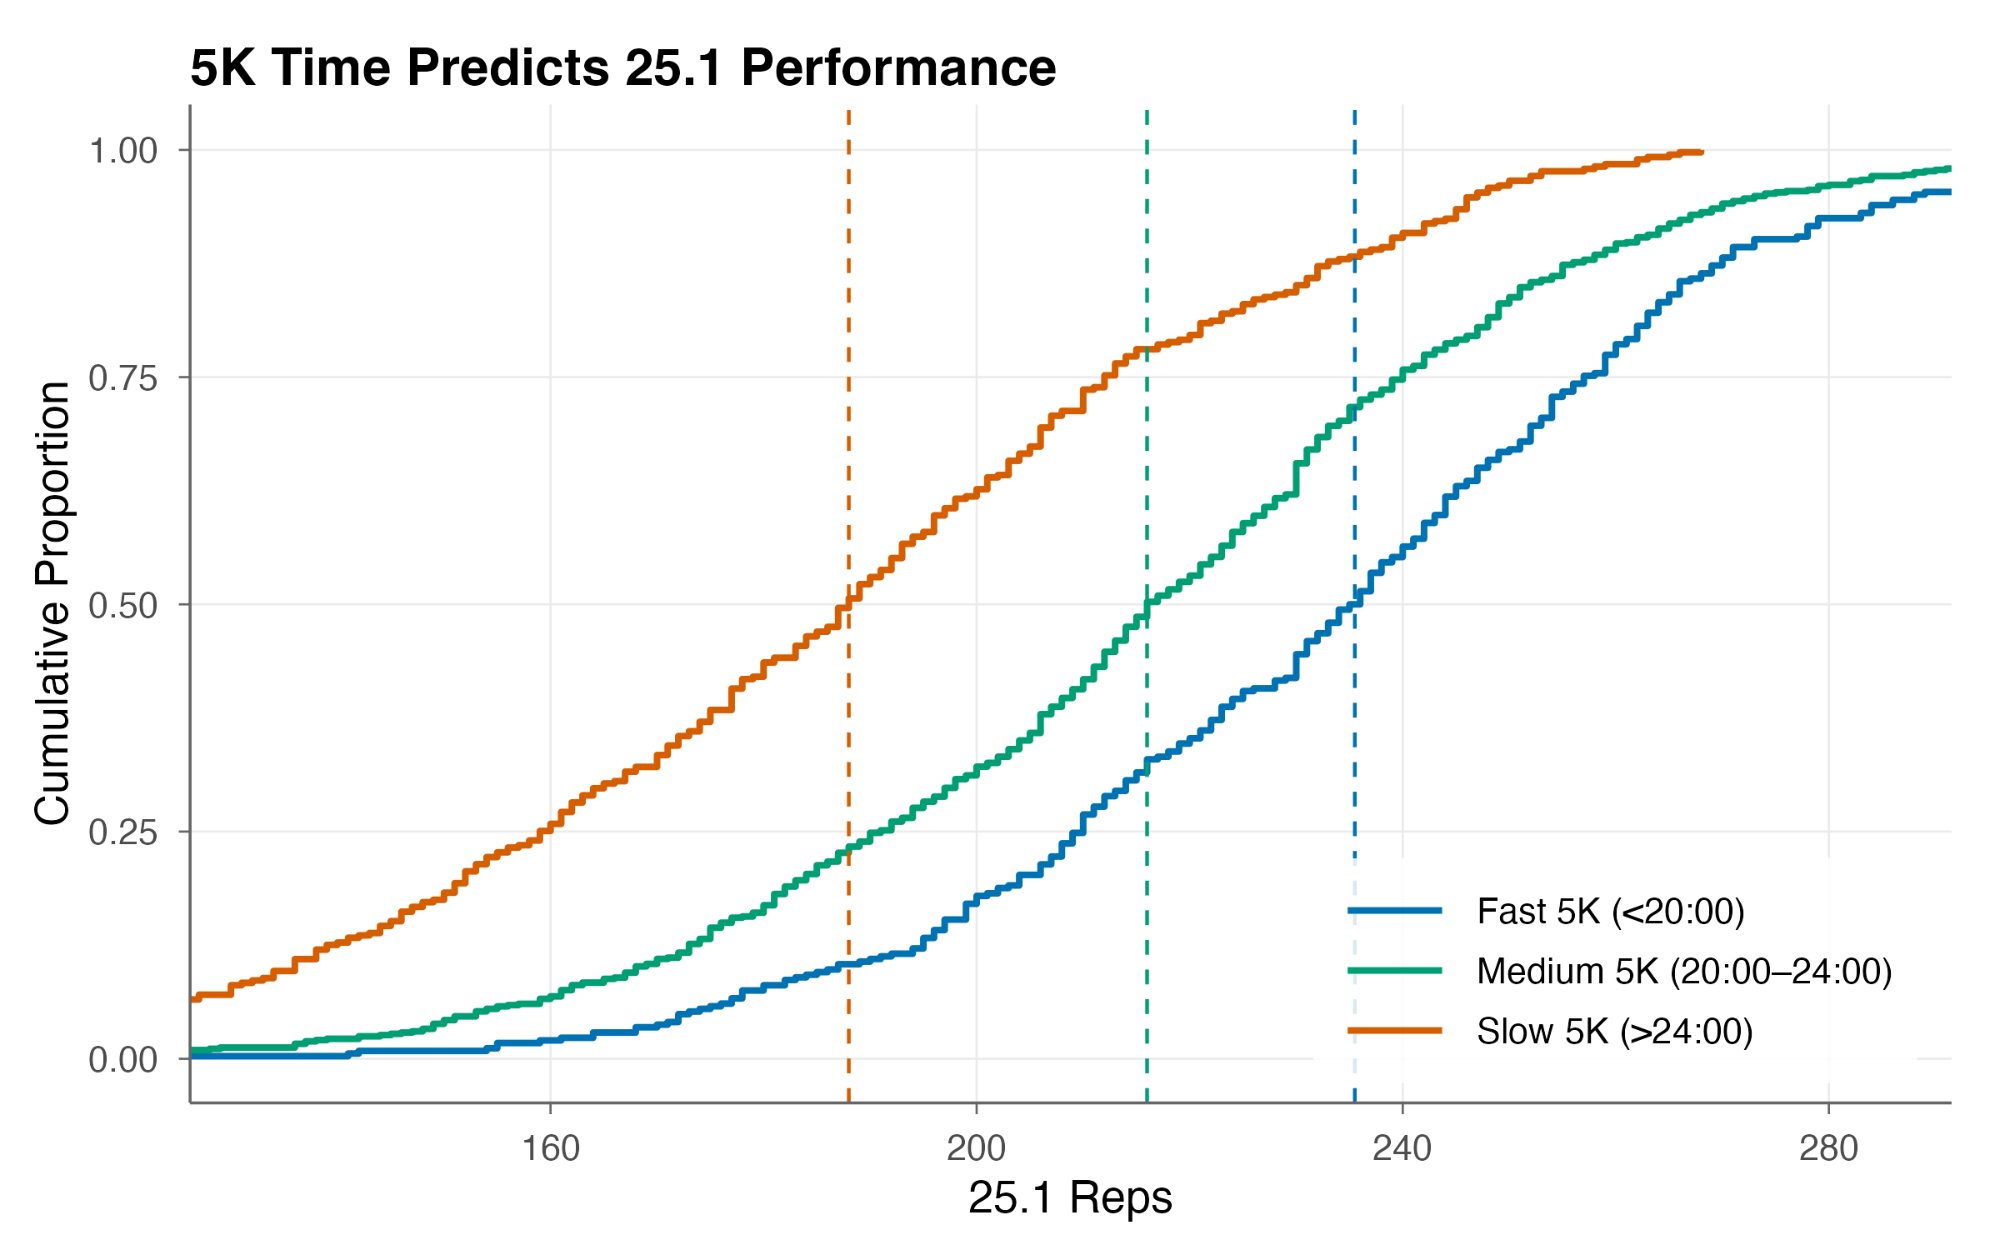
Across all three workouts, 5K run time predicted performance more strongly than any other continuous predictor. 5K serves as a proxy for aerobic capacity, though it also captures running-specific efficiency and pacing ability.
In 25.1, male athletes at the 10th percentile of 5K time (the fastest) are predicted to score 221 reps; those at the 90th percentile (slowest), 201 reps, representing a 19-rep marginal effect.
The pattern held in 25.2 and 25.3. Faster 5K times meant higher completion probability (+1.8 pp in 25.2, +4.5 pp in 25.3 comparing p10 to p90) and faster completion times among finishers (~41 seconds in 25.2, ~54 seconds in 25.3). The effect didn’t flatten, in that faster was always better, with no apparent ceiling.
The Open tests sustained output. Time caps of 12-20 minutes, ascending rep schemes, and multiple movement transitions all favour athletes who can maintain work rate over time. For athletes who have the skill gates cleared and strength above threshold, aerobic capacity is what separates performers.
Notice that the 5K effect was largest in 25.1 (a pure AMRAP with no skill gates) where 19 reps represents roughly 10% of the median score. In 25.2 and 25.3, where skills like bar muscle-ups and wall walks gate progression, the 5K effect was more modest. This reinforces the threshold model, in that conditioning can only express itself once the gates are cleared.
This also explains a gender difference in the data: 5K run time predicted 25.1 performance 6× more weakly for women than men. Not because conditioning doesn’t matter for women, but because skills were still gating performance.
Training Implications
The specific numbers from these models come with caveats. The sample is biased toward athletes who track comprehensively. Continuous metrics are self-reported. Models are subject to misspecification. The effect sizes shouldn’t be taken as ground truth.
But the approach itself is valuable. Using predictive models (with clear mechanistic assumptions) can develop normative targets and a hierarchy of training priorities. Rather than relying on intuition about what matters, we can ask empirically about the optimisation problem at the core of training. With many different capacities to develop, where should an athlete focus their limited training time?
A Hierarchy of Priorities
The results suggest different capacities matter differently depending on where an athlete sits:
For athletes building toward completion of workouts: Skills are high leverage. An athlete who can’t do ring muscle-ups or strict HSPU faces a ceiling that no amount of conditioning will overcome. The process of acquiring skills builds transferable capacities (pulling strength, pressing strength, overhead stability) that help broadly.
For athletes who can finish but want to compete on time: Strength and conditioning differentiate. The squat EC50 of 150 kg suggests a threshold. Below it, strength limits performance and above it, returns diminish. Meanwhile, 5K time and pulling endurance show no plateau. An athlete with a 170 kg squat gains more from conditioning work than from chasing a 190 kg squat. Olympic lift technique also becomes relevant at this stage. Athletes lifting below their predicted numbers may have technique as a limiter and require more specific work.
For female athletes: The skill gates remain more binding. Handstand walks (27% prevalence) and strict HSPU (49%) are genuine limiters where they’re near-universal for competitive men. Skill acquisition phases may need to be longer before conditioning becomes the primary lever.
The Value of Normative Targets
The point isn’t that 150 kg is a magic number. It’s that having empirically-grounded targets (even imperfect ones) allows more thoughtful programming. An athlete can locate themselves relative to approximate thresholds and clearly determine their priorities.
This framework scales. The same modelling approach could generate targets for different competitive tiers, different age groups, or different training phases. The value is in the structure of hierarchy of priorities grounded in data.
Summary
The 2025 Open rewarded skills and aerobic capacity, in roughly that order of importance for most athletes.
Skills transfer. Ring muscle-ups, strict HSPU, and handstand walks predicted performance across workouts that didn’t test them directly. Ring muscle-up ability adds 31 reps to expected 25.1 score; strict HSPU adds 9-14 percentage points to completion probability. Whether this reflects genuine capacity transfer or selection effects is hard to disentangle, but skill indicators carry predictive signal well beyond the movements they measure.
5K run time is the dominant differentiator. Aerobic capacity predicted performance more strongly than any other continuous measure, with no plateau observed. The effect was largest in 25.1 and more modest in skill-gated workouts, reinforcing that conditioning can only express itself once underlying strength and skill is addressed.
Strength shows threshold effects. Below ~150 kg squat, strength limits performance. Above it, returns diminish sharply. This contrasts with 5K and pulling endurance, which continue to differentiate across the entire observed range.
The value is in the approach. The specific numbers come with some hedging of our bets. But the framework of using predictive models to develop normative targets and training hierarchies is broadly applicable. Athletes can locate themselves relative to empirically-grounded thresholds and allocate training time accordingly.