Speed as a Necessary Condition: Dose-Response Relationships in Sprint Kayaking
The relationship between top speed and race pace in sprint kayaking is an interesting one. It seems obvious that an athlete with a higher maximum velocity is better, much like how increasing a 1RM in the gym feels productive. But the shape of that relationship matters enormously for training prescriptions.
In this post, I use my own Garmin data to estimate that relationship, borrowing a saturation model from pharmacology to characterise how top-end speed translates into sustained race-pace performance.
What I Measured
I extracted two metrics from 18 months of paddling sessions:
- Max continuous distance above a pace threshold: for each session, the longest unbroken stretch paddled faster than a target pace (4:00, 3:50, 3:40, and 3:30 min/km). This captures the ability to sustain effort at or near race intensity, the thing we actually care about in a 200m or 500m event.
- 7-day rolling max speed: the highest instantaneous speed recorded in the preceding seven days. This serves as a proxy for current top-end neuromuscular capacity.
The modelling question is simple: does having a higher speed ceiling allow you to sustain race-pace efforts for longer?
Why the Hill Equation?
A straight line is a poor model here. An athlete who can hit 25 km/h shouldn’t be able to sustain a 3:30 min/km pace indefinitely just because their top speed is high. Physiologically, there should be a ceiling, since at some point additional speed capacity stops being the limiting factor and other constraints take over.
The Hill equation, originally developed to describe oxygen-haemoglobin binding, captures exactly this kind of saturating relationship:
D = V_{\max} \cdot \frac{s^n}{K^n + s^n}
where:
- D is the predicted max continuous distance at a given pace threshold
- s is the 7-day max speed
- V_{\max} is the asymptotic distance (the theoretical ceiling if speed were unlimited)
- K is the half-saturation speed (the speed at which you achieve half of V_{\max})
- n is the Hill coefficient, controlling the steepness of the transition from “limited” to “saturated”
This functional form has a useful property: it naturally partitions the speed axis into a region where gains matter a lot (below K) and a region of diminishing returns (above K). That partition is exactly the training question we’re trying to answer.
I fit this model using Bayesian inference, estimating separate parameters for each pace threshold. This gives us not just point estimates but full posterior distributions and honest uncertainty about where the saturation point actually lies.
Results
The Saturation Curves

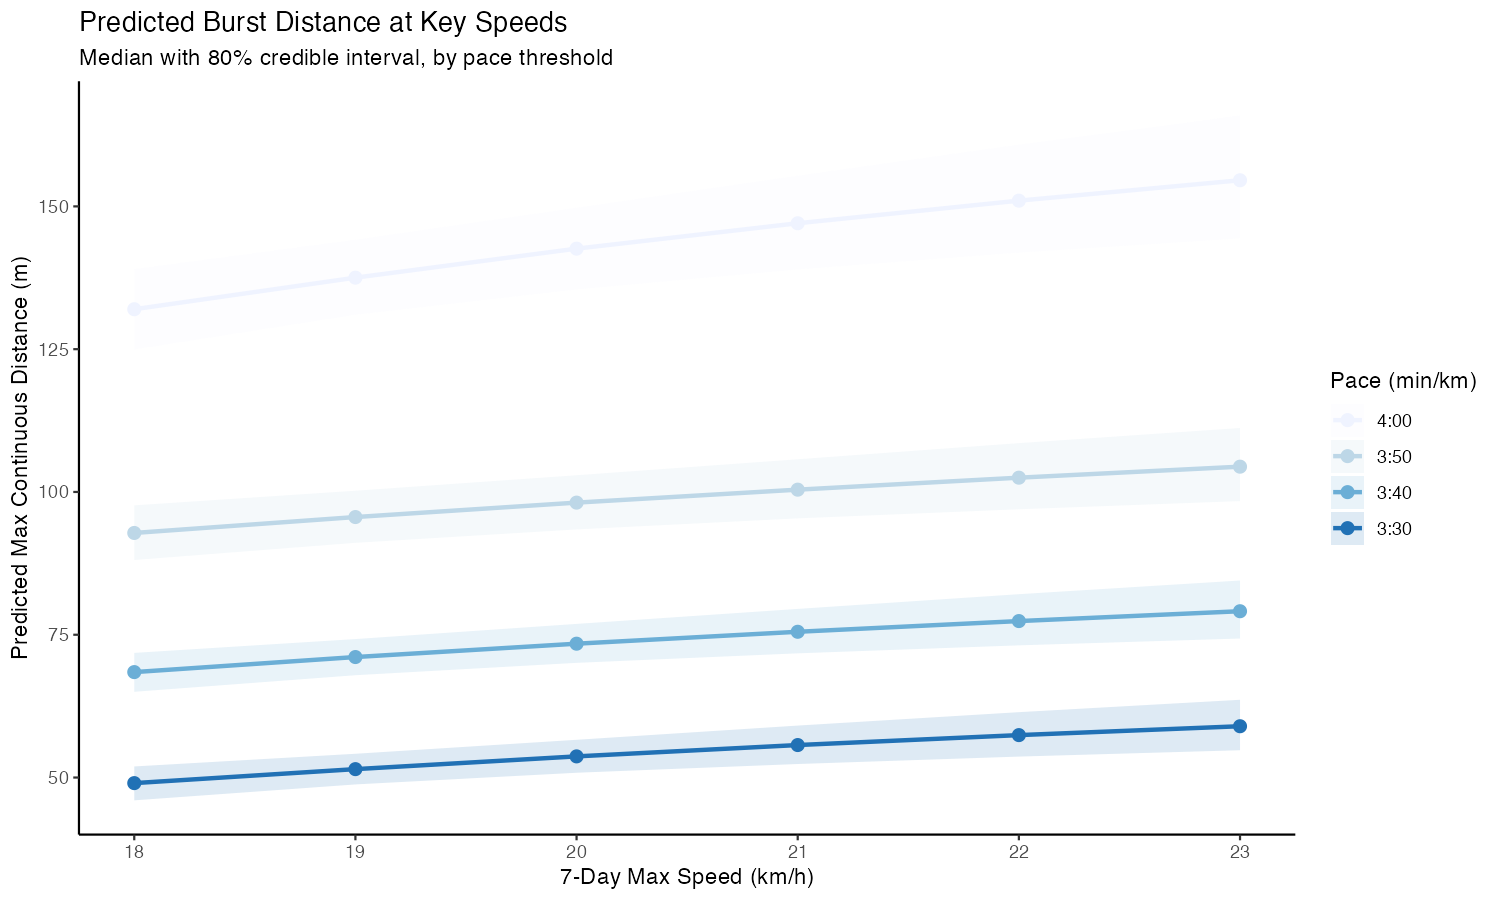
The relationship between 7-day max speed and sustained distance shows a gently saturating pattern across all four pace thresholds. The effect is not dramatic — this is real training data with all the noise that implies!
At slower paces (4:00 min/km), the asymptotic distance is higher (~130m median) and the scatter is larger. As the pace threshold tightens toward 3:30 min/km, the achievable distances compress and the saturation becomes more apparent.
A Common Speed Gateway
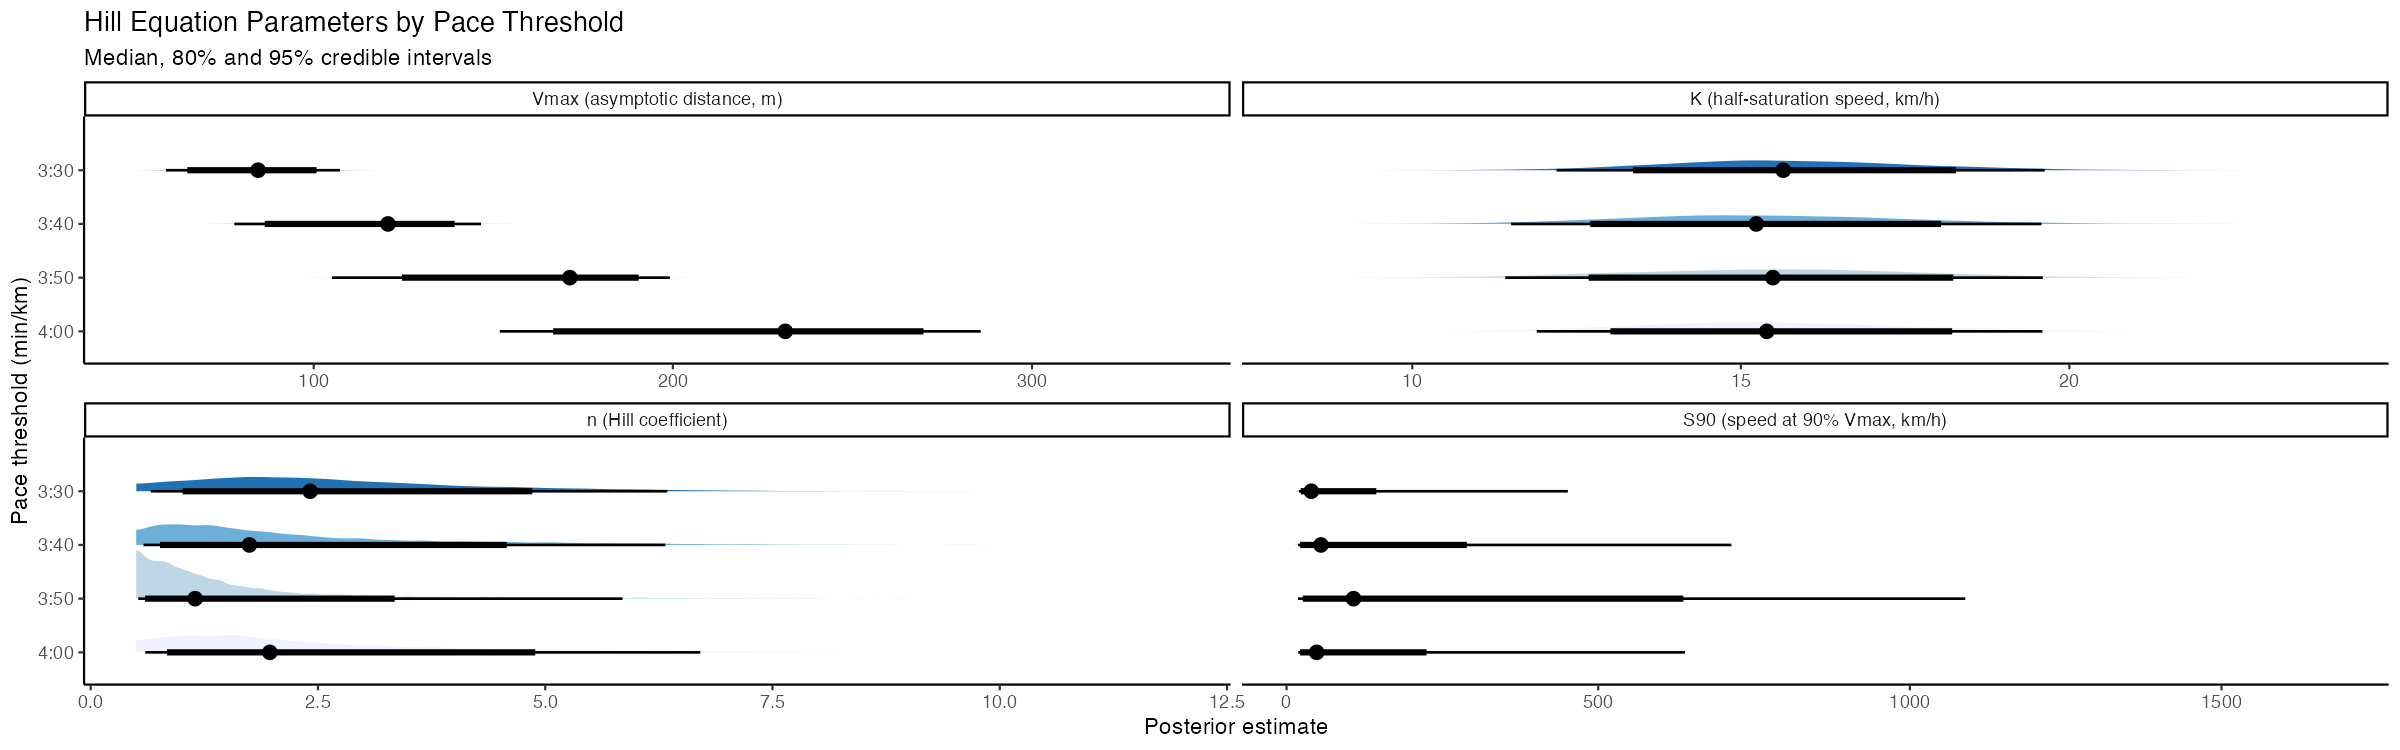
The most interesting result is in the parameter estimates. The half-saturation speed K sits remarkably close to ~15–16 km/h across all four pace thresholds. This suggests a common “gateway” speed. Below this, top-end capacity is genuinely limiting the ability to sustain pace. Above it, the marginal return on additional speed drops off.
The Hill coefficient n shows wider uncertainty at slower paces, but the median estimates suggest a relatively gentle transition rather than a sharp threshold effect. This is consistent with the idea that speed is a necessary but not sufficient condition for sustained-pace performance.
The asymptotic distance V_{\max} increases as the pace threshold loosens, as we’d expect.
Marginal Returns in Practice
To make the saturation concrete, we can ask: how much sustained distance does each additional km/h of speed buy?
| Pace | 18→19 km/h | 19→20 km/h | 20→21 km/h | 21→22 km/h | 22→23 km/h |
|---|---|---|---|---|---|
| 4:00 | +5.5m | +5.1m | +4.4m | +4.0m | +3.6m |
| 3:50 | +2.8m | +2.5m | +2.3m | +2.1m | +1.9m |
| 3:40 | +2.6m | +2.3m | +2.1m | +1.9m | +1.7m |
| 3:30 | +2.5m | +2.2m | +2.0m | +1.7m | +1.6m |
At the 3:30 pace threshold — the most race-relevant — improving your 7-day max speed from 18 to 19 km/h is associated with a median gain of 2.5 metres in sustained distance. But improving from 22 to 23 km/h gains only 1.6 metres. Each additional km/h of speed capacity buys progressively less transfer to sustained pace, and the absolute gains are modest relative to the session-to-session variability in the data.
The pattern is consistent across all thresholds: the curve is flattening across the observed speed range. There is no sharp cutoff where speed stops mattering, but the marginal return is clearly diminishing.
A Note on What This Does and Doesn’t Say
These thresholds describe the transfer from speed capacity to sustained-pace performance, not the speeds required in competition. A competitive 500m paddler operates well above 20 km/h in a race. The question is whether pushing your training speed ceiling from, say, 21 to 23 km/h meaningfully improves your ability to hold race pace for longer, or whether that training time is better spent elsewhere.
The Hill coefficient is not well-identified in this dataset. The posterior is wide, reflecting genuine uncertainty about whether the saturation is gradual or sharp. We can confidently say that saturation exists, but we cannot precisely pin down where the curve flattens out completely. We have limited ability to extrapolate beyond the data range, but since we know that world-class paddlers can hit ~24 km/h this isn’t a major limitation.
Implications for Training
The practical story is one of diminishing marginal returns. At the race-relevant 3:30 pace, each km/h of speed above 18 km/h buys roughly 2 fewer metres of sustained distance than the last. It means the return on investment shifts. Below the half-saturation point (~16 km/h), speed is genuinely constraining race-pace ability and speed development should be prioritised. Above it, and particularly across the 18–23 km/h range where most trained paddlers operate, the bottleneck is increasingly elsewhere — the ability to sustain effort, resist fatigue-induced technique breakdown, or execute pacing strategies.
This connects to a broader point explored in previous posts on periodisation. The dominant models in sport science tend to treat capacity dimensions as independent and linearly responsive to load. What the Hill equation captures is that the relationship between capacities is more like a series of gates. You need to pass through the speed gate before other factors become the binding constraint, but once through, continuing to invest in speed alone is a poor allocation of training time.
Extending This Approach
This analysis uses a single predictor, but the framework naturally extends to multiple inputs. Two directions are worth pursuing.
The first is recovery. How does sleep quality moderate the speed-to-distance relationship? I’ve been a long time user of the Oura ring. There appears to be a correlation between total sleep, full recovery and improvement in key metrics that can be investigatedfully.
The second is sport-specific endurance measures. Top-end speed captures neuromuscular capacity, but something like a 12-minute test captures aerobic capacity. These two predictors may gate different parts of performance, withspeed determining whether race pace can be held, and endurance determining for how long. A multi-predictor model could identify which is the binding constraint at any given point in a training cycle.
The question shifts from “does speed predict sustained performance?” to “which capacity is currently the limiting factor?” providing a much richer training prescription.
Data source: Personal Garmin data, July 2024–February 2026. Analysis conducted using Bayesian inference in R/Stan.