What Competition Data Reveals About CrossFit Performance Transfer
In a previous post, I modelled CrossFit Open performance using self-reported athlete characteristics (lifting maxes, 5K run time, max pull-ups) alongside binary skill indicators derived from past competition scores. It worked, but self-reported data has well-known limitations: it’s noisy, it captures isolated capacities rather than how they interact, and it can’t tell you whether an athlete can actually express their strength or endurance through complex movement patterns under fatigue.
This post takes a different approach. Instead of asking “what are your numbers?”, I ask “what have you demonstrated?”, using competition scores from the 2023-2024 Open and 2023 Quarterfinals to predict performance on the 2024 Quarterfinals. The predictors are objective, competition-verified, and they capture something self-reported metrics fundamentally cannot: the ability to integrate multiple capacities under competitive pressure.
The Data
The analysis uses 2,427 male athletes who competed in both the 2023 and 2024 Quarterfinals, with Open scores from 2023 and 2024. This gives us a panel of returning competitors, a population that represents serious, multi-year competitive athletes rather than casual Open participants.
The predictor set draws from seven Open workouts across the 2023 and 2024 seasons (23.1, 23.2a, 23.2b, 23.3, 24.1, 24.2, 24.3) and 2023 Quarterfinals scores, selected based on data coverage and relevance. Each predictor is an objective competition score: reps completed, time achieved, or load lifted.
The four 2024 Quarterfinals workouts serve as outcomes:
- QF1: 4 rounds of 1-minute snatches, 1-minute row calories, 1-minute DB box step-ups, 1-minute rest (total reps)
- QF2: 3 rounds of 50 wall-ball shots + 50 lateral burpee box jump-overs (time, 20-min cap)
- QF3: Gymnastics pyramid, including kipping HSPU/toes-to-bar, strict HSPU/rope climbs, chest-to-wall HSPU/muscle-ups (time, 15-min cap)
- QF4: Ascending clean and jerk ladder, 10 reps at four increasing weights (total reps, 10-min cap)
Modelling Approach
I fit Bayesian Hill dose-response curves to characterise the relationship between each predictor and each outcome. The Hill equation captures saturating, nonlinear relationships (the same framework used in my kayaking dose-response analysis), allowing us to identify where a capacity is genuinely constraining performance and where additional gains yield diminishing returns.
The model uses an automatic relevance detection mechanism that lets uninformative predictors shrink toward zero, so only predictors with real signal influence the outcome. Two model types handle the different scoring formats: a negative binomial model for rep-based AMRAP workouts (QF1, QF4), and a multipart model for capped workouts (QF2, QF3) that separately estimates the probability of completing the workout and the completion time conditional on finishing.
Results
Rather than walking through each model individually, I want to highlight three patterns that emerge across the four models, patterns that tell us something about the structure of CrossFit performance at the Quarterfinals level.
Aerobic capacity is the common thread
Workouts that demand sustained output, particularly rowing, appear as significant predictors across almost all four outcomes, though their role shifts depending on what’s being tested.
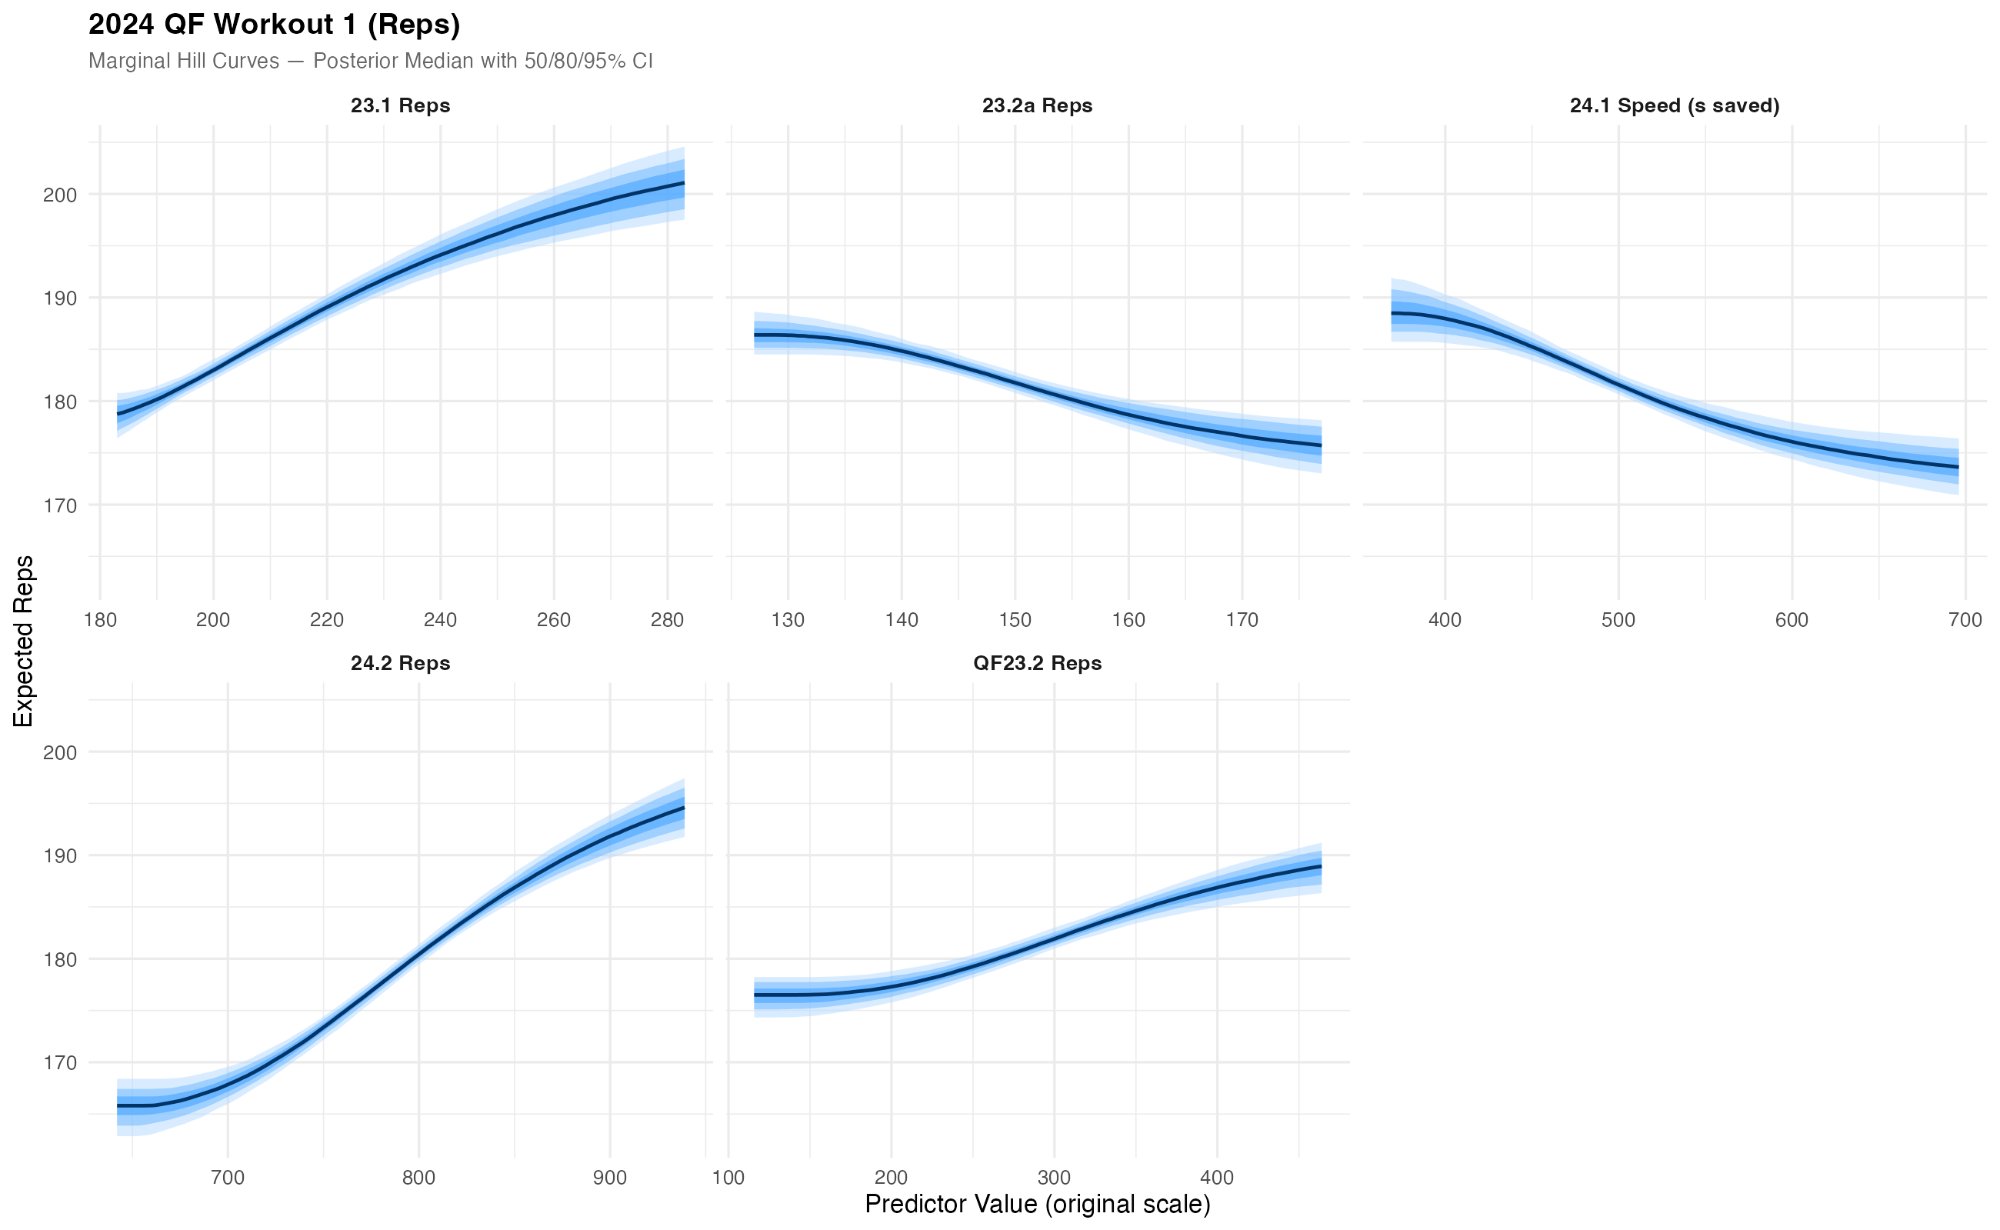
For QF1 (the interval workout with snatches, rowing, and step-ups), the two strongest predictors are 23.1 Reps and 24.2 Reps. Both workouts involved substantial rowing volume at the top end of the rep range. For the athletes in this cohort, scoring highly on 23.1 required completing 20 ring muscle-ups and then rowing 60+ calories, while 24.2 had top athletes covering over 3km. This is an important nuance: these predictors aren’t capturing raw aerobic capacity in isolation. They’re capturing rowing ability conditional on a high base of gymnastics and mixed-modal fitness, the kind of integrated output that only surfaces when an athlete has already cleared the skill and strength gates. An athlete with a strong 2K row time but poor muscle-ups would never reach the rowing section of 23.1, and would therefore not register as aerobically capable by this measure.
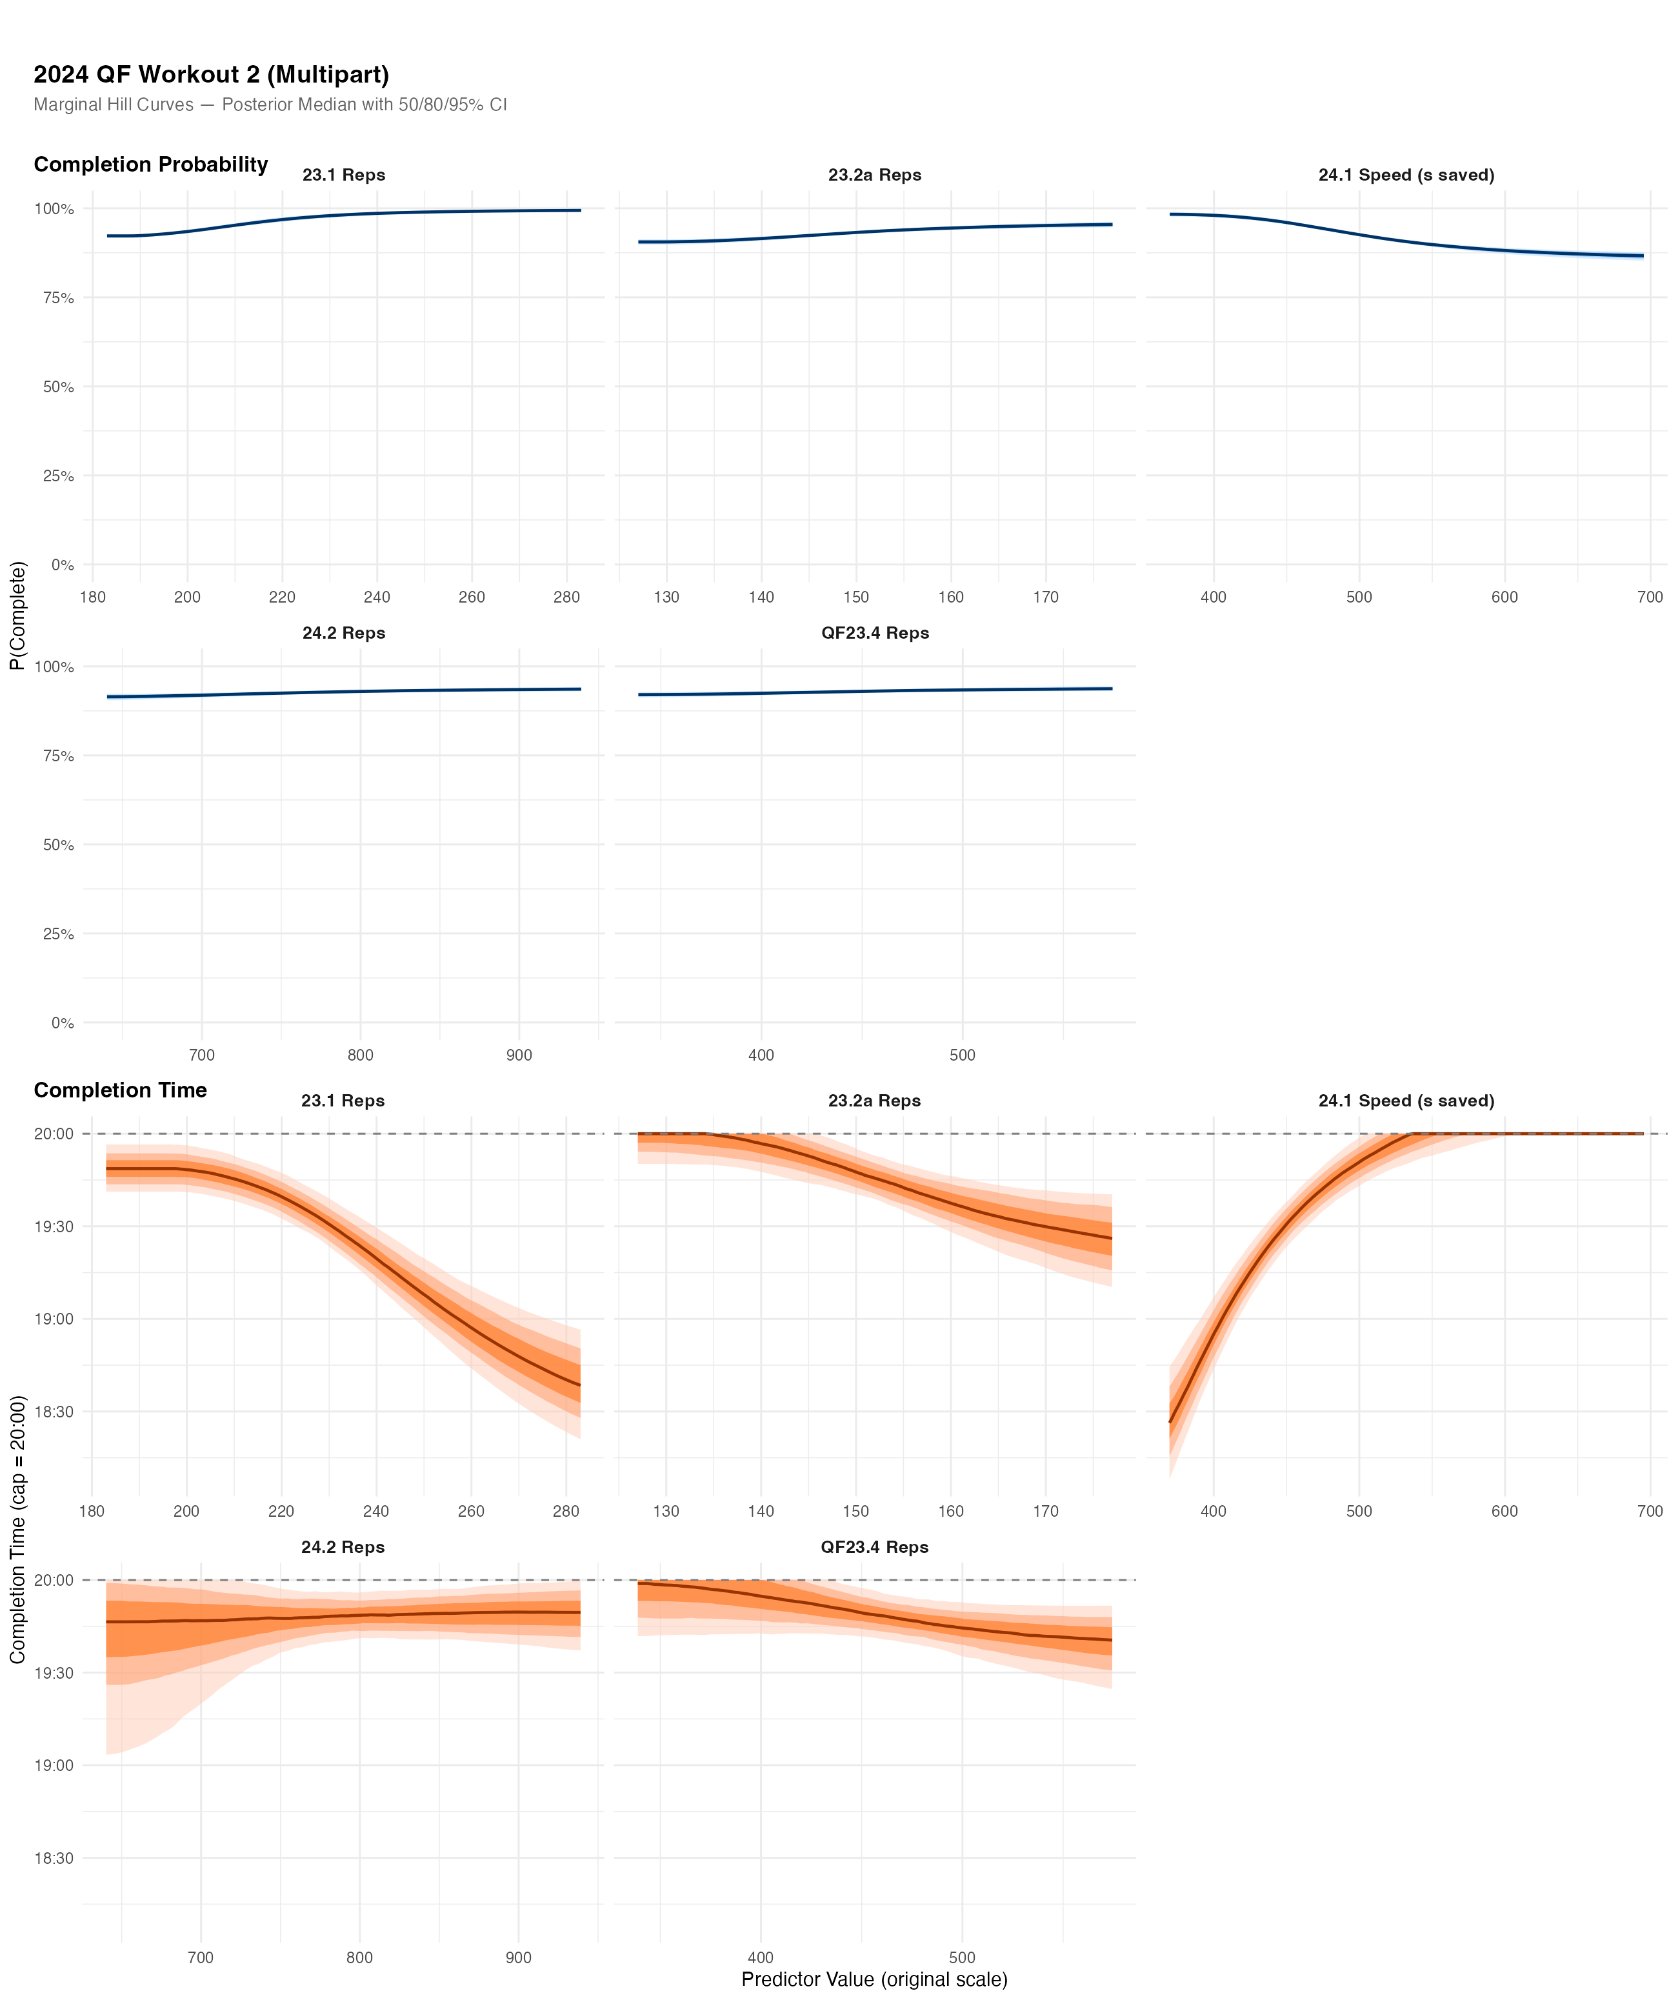
For QF2 (the pure engine test of wall balls and burpee box jump-overs), the completion probability curves are nearly flat: among returning QF competitors, almost everyone finishes. The interesting story is in the completion time model, where 23.1 Reps, 23.2a Reps, and 24.1 Speed all show clear relationships. 24.1 Speed is the strongest, which makes sense: 24.1 included 90 lateral burpees, directly transferable to the burpee box jump-overs in QF2. The aerobic markers (23.1 rowing, 23.2a) capture the sustained output required to maintain pace across 300 reps.
For QF4 (the ascending clean and jerk ladder), aerobic predictors still contribute. 23.1 Reps and 24.2 Reps show moderate positive relationships even though this is a strength-dominant workout. This suggests that once an athlete has the required strength to handle the ascending barbells, conditioning still differentiates performance at the heaviest weight.
Movement-specific transfer is real and detectable
The model discovers which historical tests share underlying capacities with each QF outcome, without being told what movements are in common.
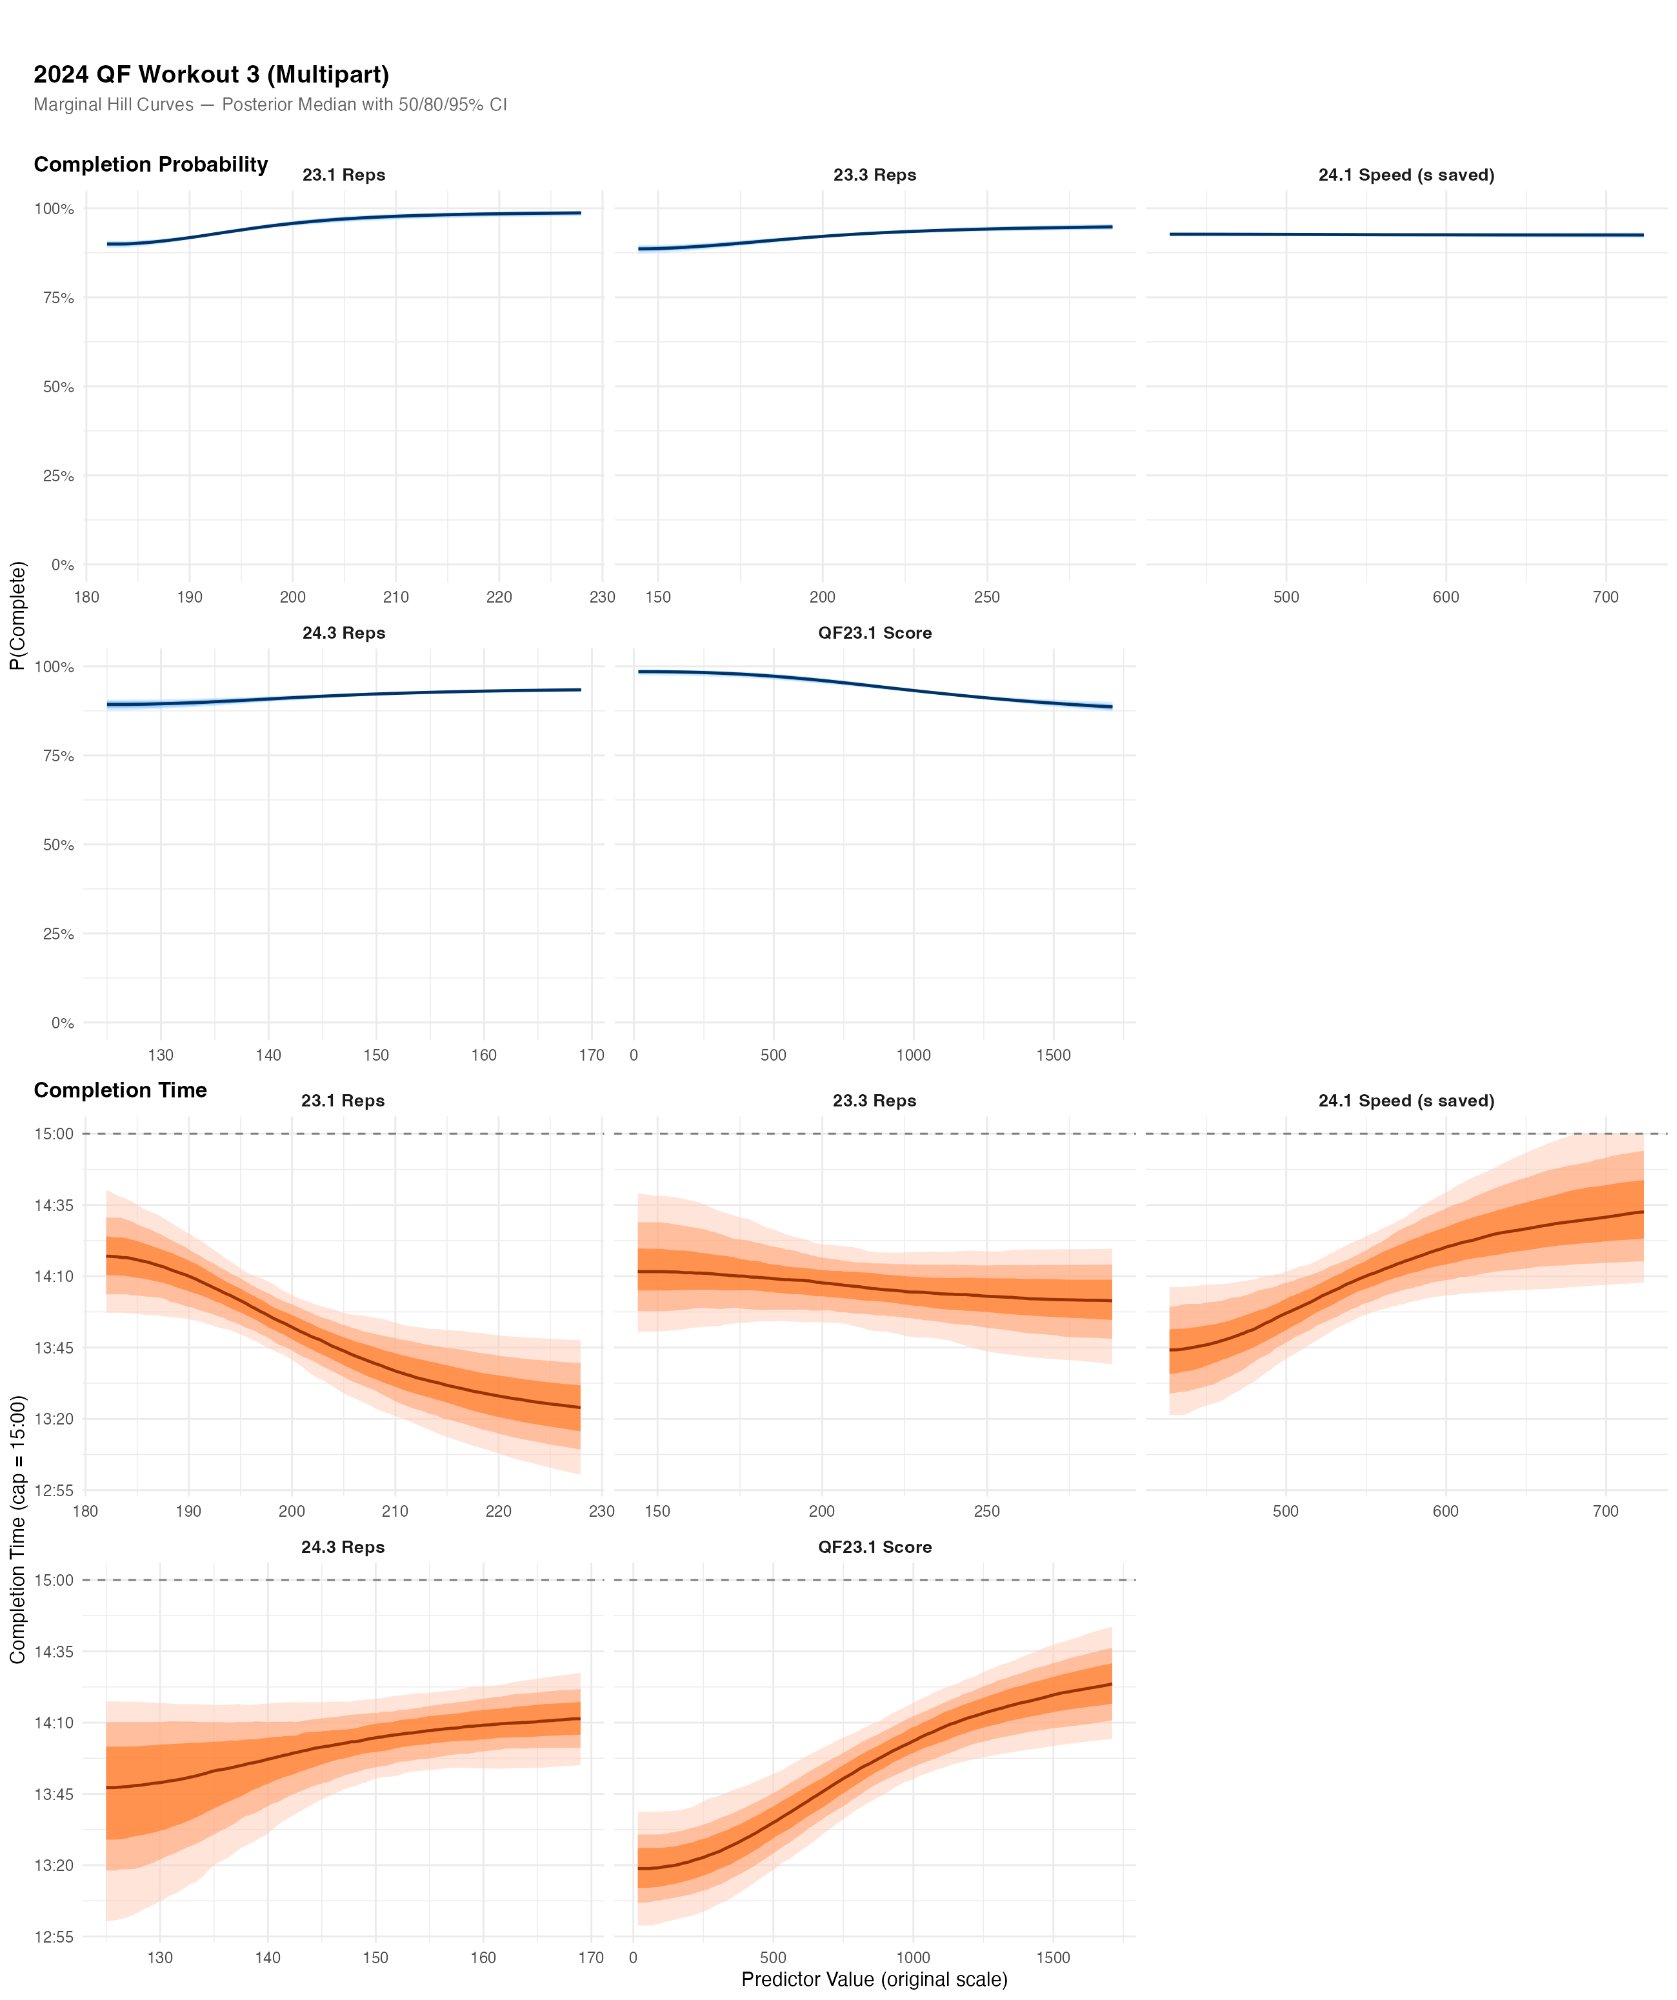
QF3 (the gymnastics pyramid of HSPU variations, toes-to-bar, rope climbs, and muscle-ups) is best predicted by workouts that are themselves gymnastics-dense. 23.3 Reps, 24.3 Reps, and QF23.1 Score all involved significant gymnastics volume, and all show clear relationships with QF3 completion time. These predictors do not appear prominently in the QF4 model, confirming that the model is detecting genuine movement-specific transfer rather than a generic fitness signal.
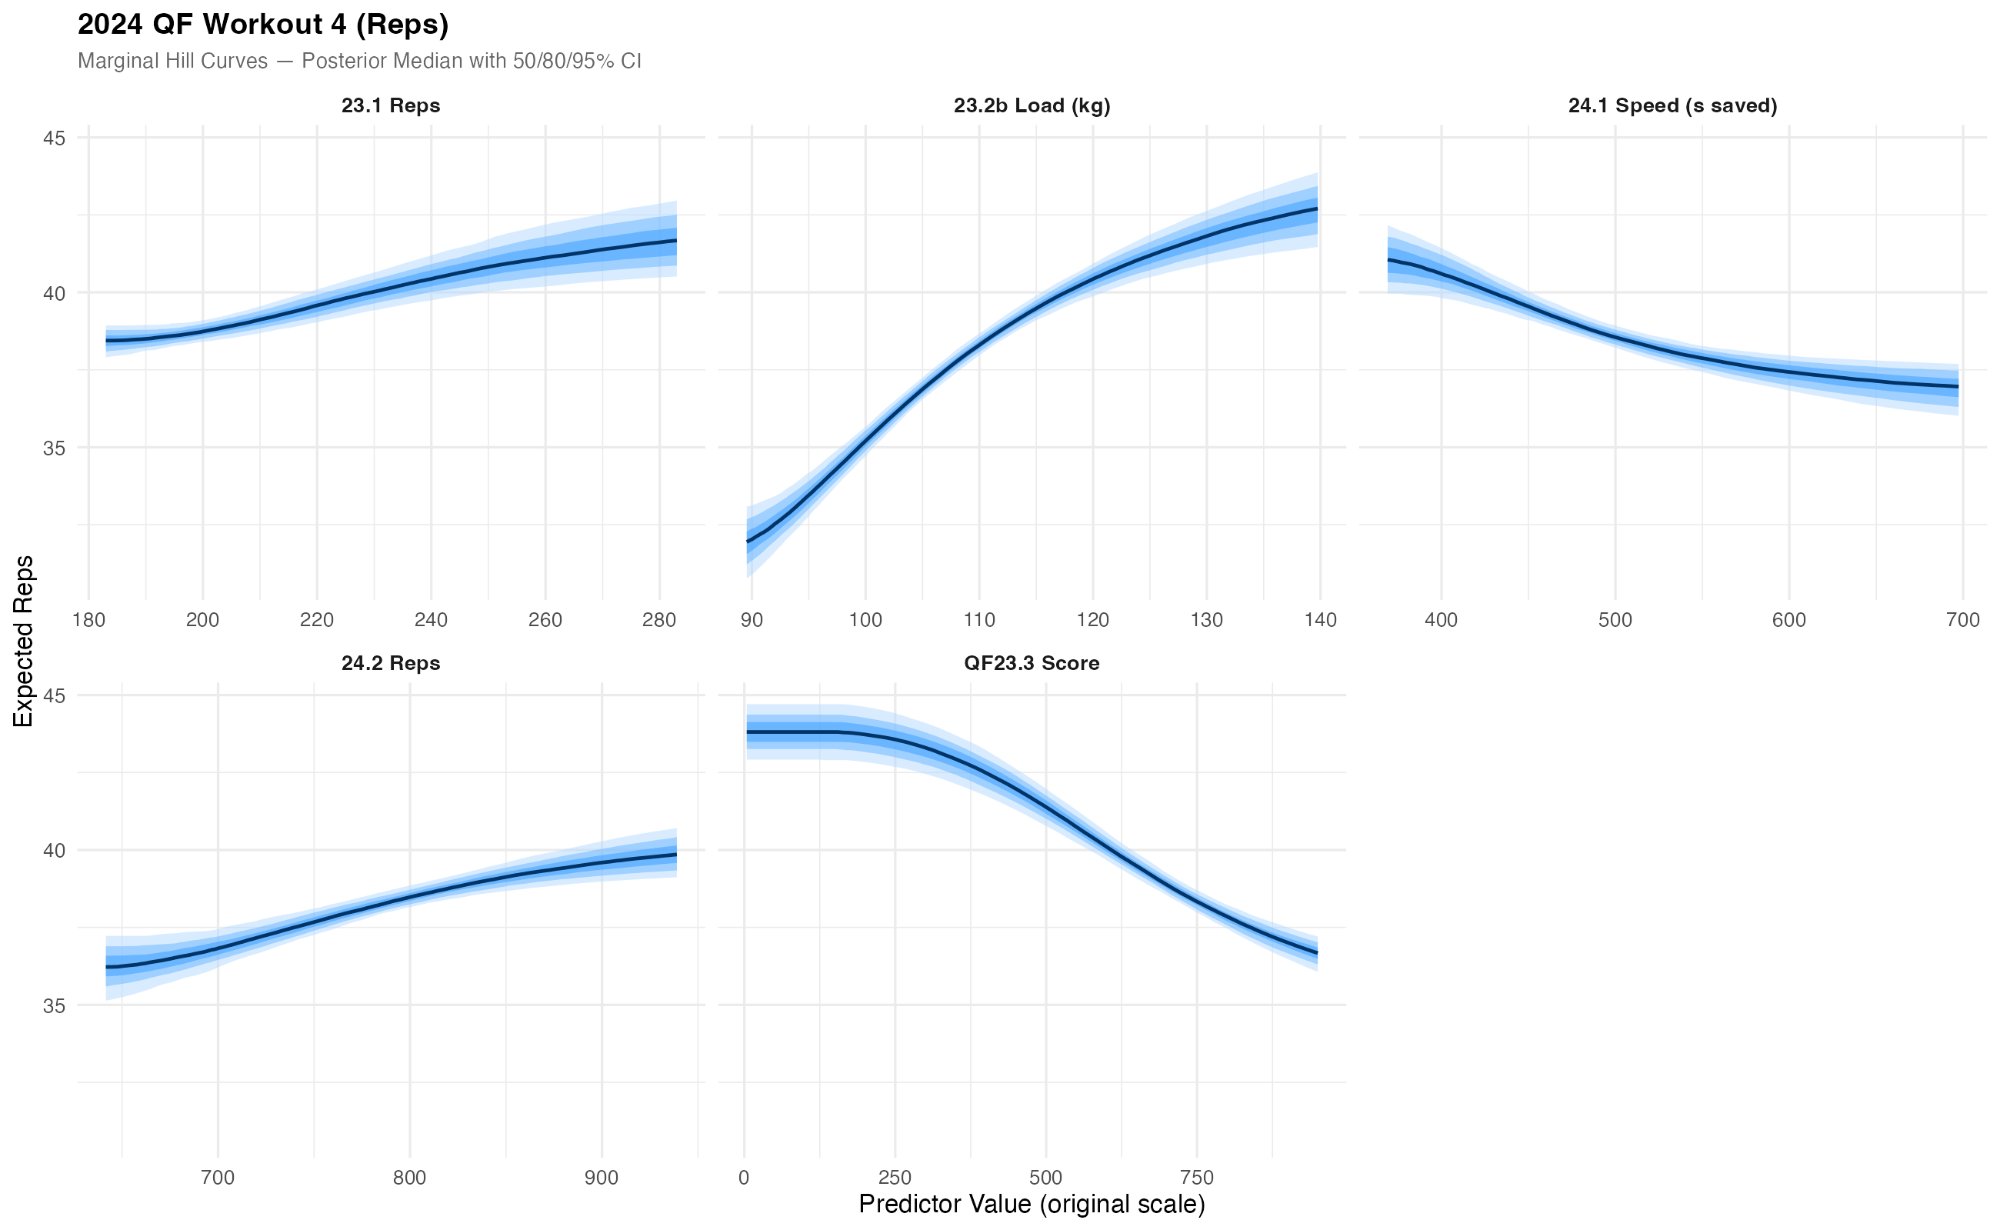
Conversely, QF4 is dominated by 23.2b Load (1RM clean) and QF23.3 Score (which included heavy clean and jerks). The 23.2b Load curve is the single clearest result in the entire analysis, showing a steep rise from roughly 33 to 42 expected reps as clean load increases from 90 to 140 kg, followed by a plateau. This is a textbook capacity gate: athletes need a minimum strength threshold to be competitive, but beyond that threshold, additional strength yields diminishing returns (a pattern that mirrors the saturation effects observed in my kayaking dose-response analysis, suggesting capacity gating is a general feature of athletic performance).
Competition scores capture integration ability
A striking feature of the results is that 24.1 Speed appears as a predictor across multiple outcomes (QF1, QF2, and QF3) despite 24.1 not sharing specific movements with all of these workouts. The 2024 Open workout 24.1 required athletes to integrate multiple capacities under a time constraint, including 90 lateral burpees. Performing well on it requires not just individual capacities but the ability to express them fluently through varied movement patterns.
This is the key advantage of competition data over self-reported metrics. A self-reported 1RM tells you how strong an athlete is in isolation. A competition score tells you how well they can deploy that strength alongside other demands: pacing, transitions, movement efficiency under fatigue. The Open modelling piece found that self-reported characteristics explained meaningful variance in Open performance. But competition scores go further, capturing a latent “integration ability” that isolated metrics cannot measure. Formalising this latent structure, extracting the underlying capacities that competition scores implicitly encode, is an active direction for future work.
Limitations
This analysis is conditioned on athletes who competed in both the 2023 and 2024 Quarterfinals. This is a committed, multi-year competitive population, and the predictor relationships we observe apply to this group. Athletes competing in their first Quarterfinals may show different patterns, particularly on QF2 where 75% of our sample completed the workout compared to 27% in the broader QF population.
The models are currently fitted on male athletes only. Future work will explore extensions to the female division.
Developing This Approach
The results here are a starting point rather than an endpoint. Three directions are worth pursuing.
Data-driven workout taxonomy. The predictor-outcome relationships implicitly define workout families. QF3 and QF4 have almost entirely non-overlapping predictor profiles, with gymnastics-dense workouts predicting one and strength-dense workouts predicting the other. A latent variable model could formalise this structure, extracting a small number of underlying factors from the full matrix of predictor-outcome relationships. The goal would be to move from “which workouts predict which outcomes” to “what are the latent capacities that explain competition performance”, derived entirely from observed data rather than imposed by a taxonomy.
Normative targets. Once the latent factor structure is established, it becomes possible to set evidence-based targets: where does an athlete need to sit on each factor to be competitive at the Quarterfinals level? This is a richer prescription than generic benchmarks because it accounts for the nonlinear, saturating nature of the capacity-performance relationship. An athlete deep into the plateau of the strength curve but in the steep phase of the aerobic curve knows exactly where the marginal training dollar should go.
Extending the population. The current analysis is conditioned on multi-year QF competitors due to data availability. Imputation strategies or alternative linking approaches could extend the model to the broader QF population, where the completion probability models would have substantially more variance to work with and the predictor relationships may look quite different.
The broader point is methodological. Competition data provides a rich, objective, and under-utilised signal about athletic capacity. Combined with nonlinear dose-response modelling, it can reveal the structure of performance transfer in ways that self-reported metrics and linear models cannot. The CrossFit competition ecosystem, with its standardised workouts and public leaderboards, is an unusually good laboratory for this kind of analysis, and the approaches developed here generalise well beyond it.
Data source: CrossFit Games leaderboard, 2023-2024 Open and Quarterfinals. Analysis conducted using Bayesian inference in R/Stan.